
Connect your SMT data.
Investigate yield loss.
Bring inspection, process and test records into context. See where defects concentrate, compare affected production with a baseline and give engineers a focused starting point for investigation.
For electronics manufacturing and EMS quality teams.
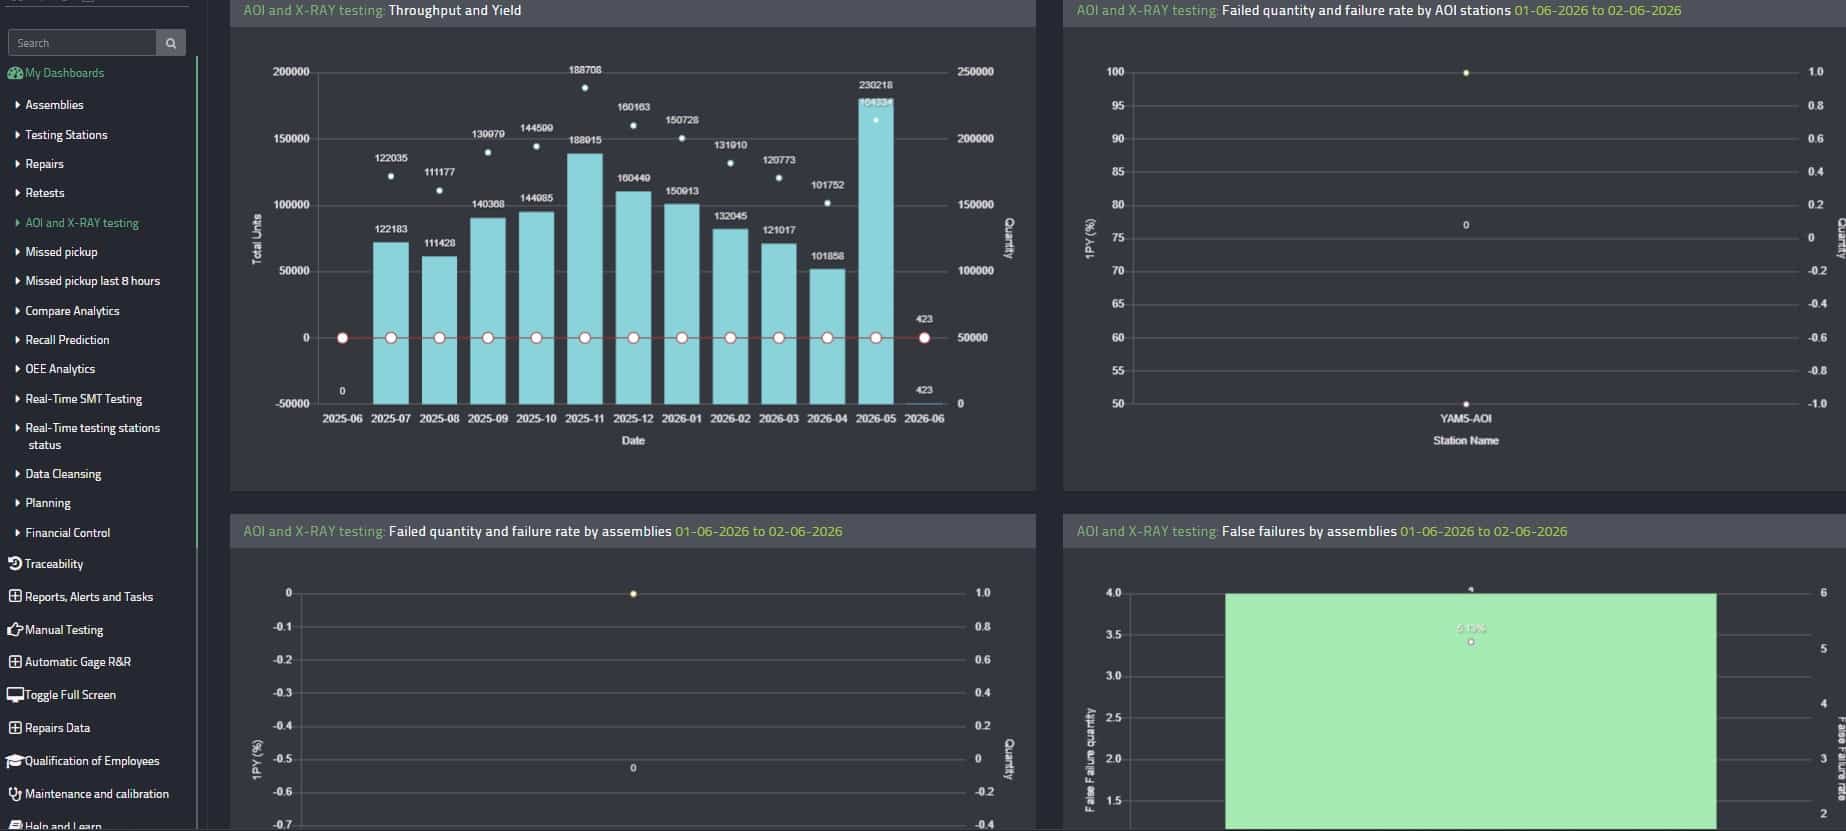
Connect the steps around a defect
Start with the records relevant to your quality question. Use shared identifiers and production context to understand which relationships the data can support.
- 01
Printing & placement
Review available SPI measurements and placement records for the affected assembly or production period.
- 02
Reflow & inspection
Compare available reflow process records with AOI or X-ray findings, including defect classes and locations.
- 03
Test & repair
Add ICT, functional test, retest and repair evidence to understand what happened downstream.
- 04
Production context
Use product, line, station, batch and time information to compare relevant groups and periods.
Match before you interpret. Board, panel or component identifiers may support different levels of traceability. Without suitable identifiers, analysis may be limited to a batch or time window.
AOI failures rise. What changed upstream?
Choose one assembly and a clear defect pattern. Compare affected boards with a suitable reference group before looking for possible drivers.
This is an investigation example, not a reported customer result. A statistical relationship is a candidate for validation, not proof of a cause.
Explore the root cause analysis workflow →Define the signal
Identify the defect class, affected product, production period and inspection station. Check whether classification or inspection settings changed.
Compare the relevant records
Where matching is possible, compare SPI measurements, placement context and reflow records for affected and reference groups.
Check alternative explanations
Review product mix, board revision, material changes, station differences and missing records. Use test and repair evidence to narrow the candidate drivers.
Validate a corrective action
Engineering confirms the hypothesis with process evidence or a controlled trial. Review comparable production afterward for defect recurrence and yield.
Scope one line, product or recurring issue
Agree the available equipment data, matching level and outcome before expanding the project.
- Confirm the source coverageReview equipment models, export formats, accessible fields and historical records.
- Check the matching qualityConfirm identifiers, timestamps, units and gaps across the selected process steps.
- Define the evaluationSet the baseline, engineering owner, success measure and review period.
Choose the next step for your quality question
Investigate recurring defects
Follow a cross-process investigation from a failure signal to engineering validation.
Root cause analysis →Understand SMT yield
Use the practical guide to review first-pass yield and the improvement workflow.
Read the SMT yield guide →Review customer evidence
See documented manufacturing outcomes and the context of individual implementations.
Explore customer stories →What to know before you start
What is SMT analytics software?
SMT analytics software brings surface mount assembly records into a connected analysis workflow. QualityLine helps teams compare inspection, process and downstream test data, investigate defect patterns and monitor yield changes.
Which SMT equipment and records can QualityLine connect?
Potential sources include SPI, placement, reflow, AOI, X-ray, ICT, functional test and repair records. Coverage depends on the equipment exports, accessible fields, identifiers and connection method. Review these with QualityLine before agreeing the scope.
Can we connect records without a shared board serial number?
A shared identifier gives a stronger basis for unit-level matching. Where it is missing, product, batch, station and time context may support a broader analysis. Confirm the available matching level and its limitations before drawing conclusions.
Does QualityLine replace SPI, AOI or test equipment?
QualityLine analyzes records alongside your inspection, test and factory systems. Those systems continue their existing roles. Any additional connection or data-collection requirements are agreed during scoping.
Is this for PCB fabrication or PCB assembly?
This workflow focuses on SMT and electronics assembly: placement, soldering, inspection, downstream testing and repair. Bare-board PCB fabrication has different process steps and should be assessed as a separate use case.
How do we measure whether an evaluation is useful?
Choose a defined product or line, agree a comparable baseline and set the measure before starting. Examples include first-pass yield, repeat failures or investigation time. Confirm the data, engineering validation and review period needed to assess the result.
Bring one quality question.
See where to start.
Walk through the relevant QualityLine workflow and discuss the data, scope and success measures for an evaluation.
Useful context for the discussion
- The product, line or recurring defect you want to investigate.
- The systems holding inspection, test and process records.
- The outcome your engineering team wants to improve.
A connection or review of your own production data is a separately agreed next step.
Explore the QualityLine platform →
