
Manufacturing analytics.
From data to decisions.
Connect production, inspection, test and repair records in one manufacturing analytics platform. See where yield is changing, investigate recurring defects and give your engineers a clearer place to act.
Built for quality and engineering teams in electronics, SMT and EMS.
One connected workflow for quality investigations
QualityLine brings records into context, applies proprietary algorithms and helps engineers decide what to investigate next.
- 01 / CONNECT
Bring in the records
Start with the relevant production, inspection, test and repair data. Agree which historical records and ongoing feeds the project needs.
- 02 / MATCH
Build a connected view
Relate records using available identifiers, timestamps and process context so teams can follow a unit, assembly or production period.
- 03 / ANALYZE
Find meaningful patterns
Compare yield and failure patterns, investigate correlations and identify changes that may signal emerging quality risks.
- 04 / ACT
Validate and improve
Use dashboards, alerts and reports to prioritize investigations. Engineers confirm causes, take corrective action and review the result.
Start with the data your factory already has
Bring the records relevant to your quality question together. The available data determines what can be connected and analyzed.
Production & inspection
Pick-and-place, reflow, solder paste inspection (SPI), automated optical inspection (AOI) and X-ray records.
Process conditions, inspection results and production context.
Test & repair
In-circuit test (ICT), functional test (FCT), flying probe, retest and repair records.
Test measurements, failure codes and repair history.
Explore test-station analytics →Factory systems
Available MES and ERP records, sensor readings and manually recorded production or quality data.
Product, line, station and time context where available.
What we review first: source access, export formats, shared identifiers, data completeness and refresh frequency. These define the integration plan and the limits of traceability.
Move from a quality signal to a focused investigation
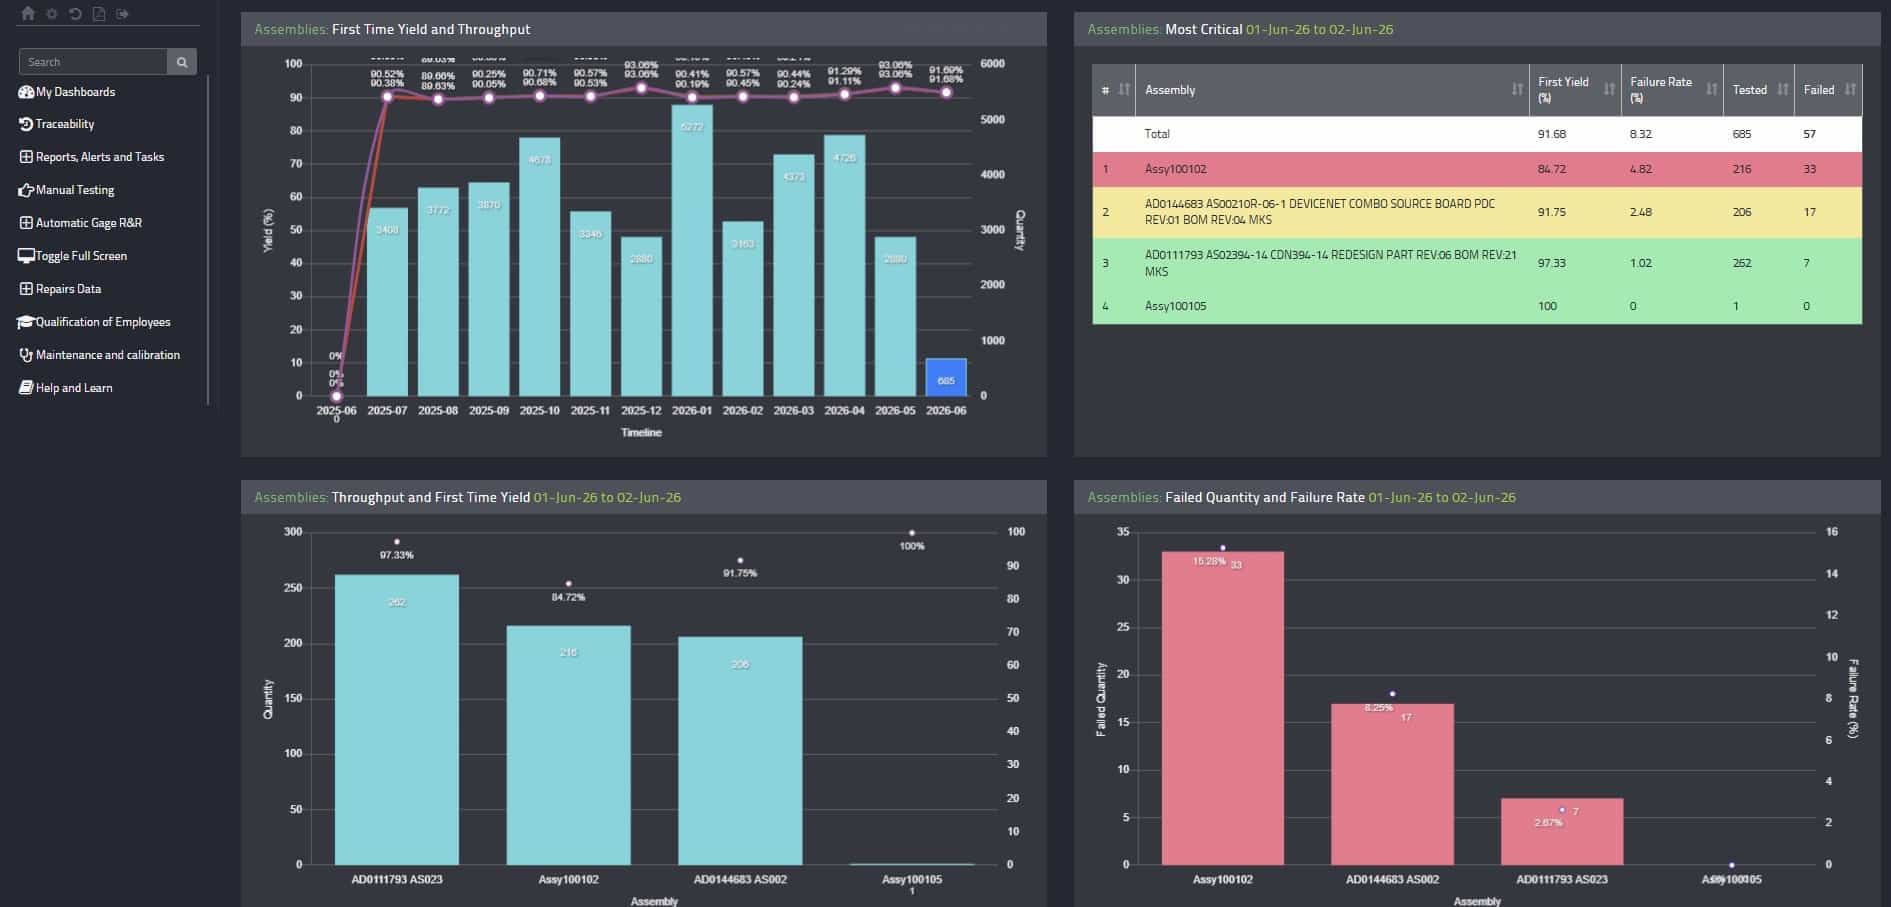
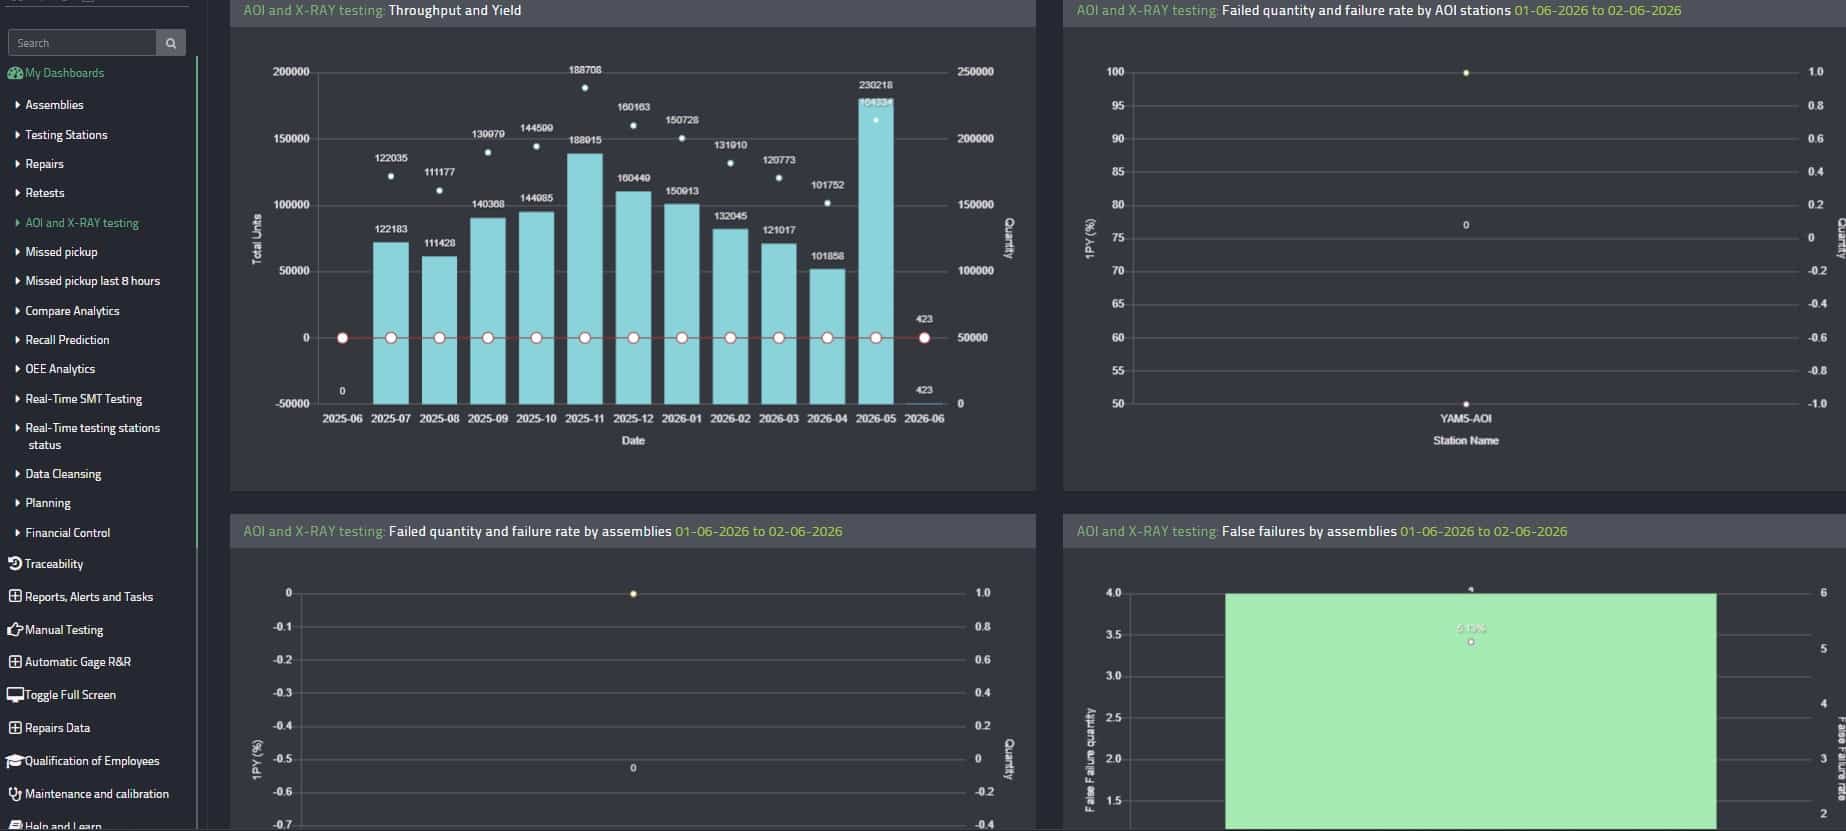
Start with the production overview, then compare the relevant stations, assemblies and periods. These QualityLine screens show examples of the views available.
Compare inspection and test performance
See where failure patterns differ across assemblies, stations and production periods.
- Review yield and failed quantities together.
- Compare station and assembly performance.
- Separate a broad trend from a localized issue.
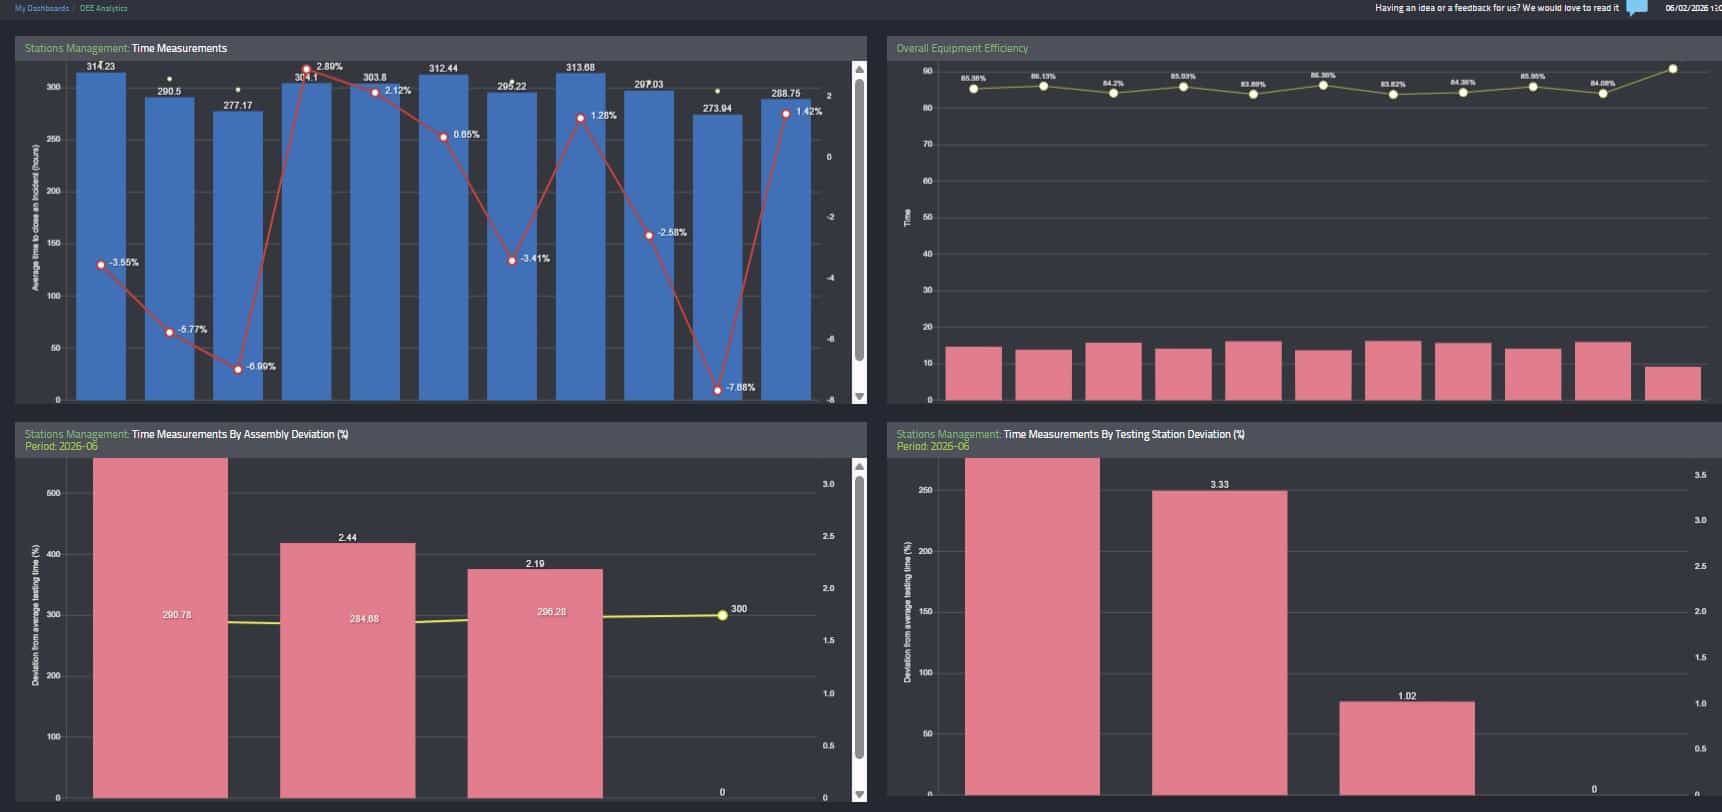
Review quality alongside equipment performance
Use overall equipment effectiveness (OEE) and station measurements to investigate where production performance changes.
- Compare station time measurements.
- Review OEE trends across production periods.
- Prioritize areas for engineering follow-up.
First-pass yield drops. Where do you look first?
Follow the signal from an overall trend to the records that help explain it.
Illustrative engineering workflow. This is an example of how to investigate, not a reported customer result.
Explore root cause analysis →Locate the change
Compare the affected product, line and time period with a relevant baseline.
Narrow the investigation
Review failure codes, test stations, retests and repair records where available.
Check the relationships
Use cross-correlation analytics to identify patterns worth testing. A correlation is a starting point for investigation.
Validate the action
Confirm the cause with engineering evidence, make the process change and track whether yield improves.
Begin with a clear question and a defined scope
Choose one line, product or quality issue to evaluate. QualityLine works with your engineering and IT teams to review the records and agree the integration approach.
- Define the outcomeAgree the baseline, quality metric and success measures for the initial scope.
- Review the dataConfirm source access, identifiers, record quality and whether historical data, live feeds or both are needed.
- Agree deliverySet responsibilities, integration work, data-handling requirements and an implementation timeline.
Results from specific customer projects
STANLEY Healthcare
Reported first-pass yield improvement of 31 percentage points.
Read the customer story (PDF) →Emerson
Reported return on investment for its implementation.
Read the customer story (PDF) →Molex
Reported increase in production capacity within the first year.
Read the customer story (PDF) →These are customer-specific outcomes. Results and timing depend on the production environment, data and implementation scope.
What to know before you evaluate QualityLine
What is the QualityLine platform?
QualityLine is a manufacturing analytics platform that brings production, inspection, test and repair data into a connected view. Its proprietary algorithms help teams investigate defects, monitor yield and identify patterns that may indicate emerging quality risks.
Which manufacturing data can we connect?
Potential sources include SMT machines, inspection and test equipment, repair records, MES, ERP, sensors and manually recorded data. The team reviews your available exports, identifiers, access and update frequency to confirm the integration scope.
Can we use historical data and live data?
Yes. Historical records can support an initial investigation and baseline. Live data can support ongoing monitoring where a suitable feed is available. Refresh frequency depends on the source and the agreed connection.
Does QualityLine replace our MES or BI system?
QualityLine adds manufacturing quality analysis alongside your existing systems. It connects available records to investigate yield, defects and process relationships. Your MES, ERP and BI tools can continue to serve their existing roles.
How long does implementation take?
Timing depends on data access, the number of sources, record quality and the analytics scope. Start with a defined line, product or quality issue. Agree the integration plan, responsibilities and success measures before implementation.
How much does QualityLine cost?
Pricing is scoped to your project. Discuss the data sources, lines or sites, required analytics, integration work and support needs with the team. Request a proposal that separates implementation scope from ongoing service costs.
How should we prepare for a demo?
Bring one production or quality question and an outline of the systems that hold the relevant records. We will walk through the product workflow and discuss fit. Any review or connection of your own data is a separate, agreed next step.
What should we confirm before sharing production data?
Agree confidentiality, approved transfer methods, access permissions, hosting, retention and any site-specific requirements with QualityLine and your IT team before sharing production data.
Bring a quality question.
We’ll walk through the product.
See how QualityLine helps your team move from connected data to an engineering investigation.
What we’ll cover
- Your production or quality priorities.
- The relevant dashboard and analysis workflow.
- Available data sources and integration questions.
- The scope and next steps for an evaluation.
Any connection of your own data is agreed separately after the initial discussion.

