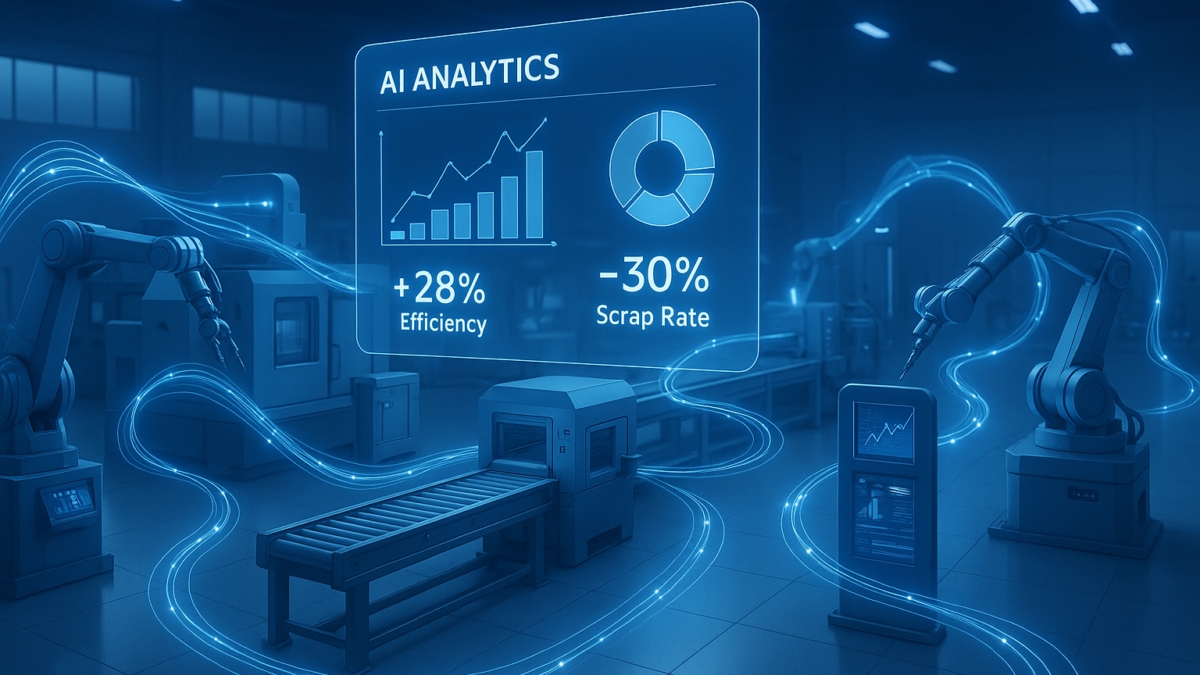
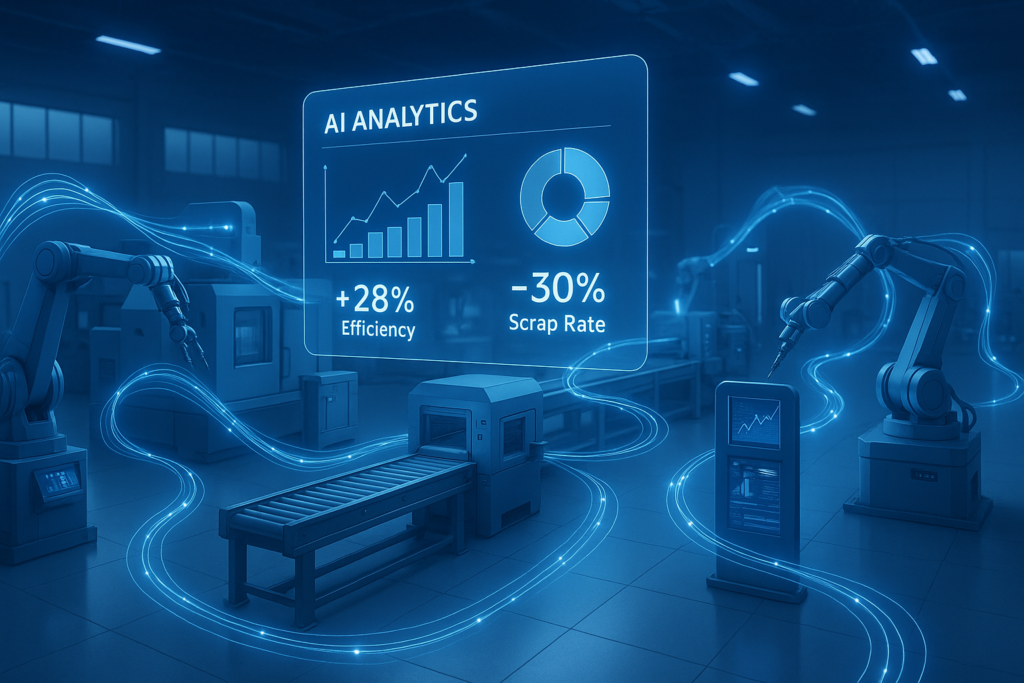
Smart Factory Analytics Platform: Connecting Data, AI, and ROI
Manufacturers are transforming their operations from reactive monitoring to proactive intelligence. At the center of this shift is the
Smart Factory Analytics Platform — a data ecosystem that connects machines, test stations, and quality systems into one
intelligent layer. With real-time analytics, predictive insights, and unified dashboards, factories can improve yield, productivity, and profitability.
On this page
What is a Smart Factory Analytics Platform?
A Smart Factory Analytics Platform is a centralized system that gathers, standardizes, and analyzes data from all production sources — including machines, testing stations, MES, and ERP systems.
It provides unified visibility across the factory floor, enabling data-driven decision-making to reduce downtime, scrap, and inefficiency.
In simple terms: it’s the brain of your factory — collecting every signal, identifying inefficiencies, and guiding where to act next.
Unlike traditional dashboards that display past data, smart factory analytics platforms use
predictive analytics
to forecast what’s coming next — turning data into preventive action.
Core Features and Capabilities
Integrates data from SPI, AOI, ICT/FCT, MES, and ERP systems for real-time correlation and reporting.
Identifies anomalies, predicts yield loss, and recommends optimal parameter adjustments.
Automatically links recurring defects to machine, line, or supplier sources —
powered by Automatic Root Cause Analysis.
Live KPI dashboards give full transparency across production lines, shifts, and facilities.
Monitors yield and failure patterns at the test stage using
Testing Stations Analytics.
Business Benefits and ROI Impact
Adopting a smart factory analytics platform delivers measurable business results within months. It bridges the gap between
quality, production, and business performance — turning insights into profit.
Reduced scrap and rework
Predictive alerts and root-cause correlation help cut rework and scrap by 15–30%.
Improved First Pass Yield (FPY)
Automated anomaly detection increases FPY by 10–25%, directly boosting output.
Faster troubleshooting
AI-driven analytics shortens root-cause analysis by up to 50%, freeing engineering time.
Higher equipment utilization
By spotting inefficiencies early, lines run more consistently and at higher uptime rates.
Discover how these benefits translate into financial value with the
QualityLine Manufacturing ROI Calculator.
Real-World Use Cases
Here’s how smart factory analytics platforms create measurable results across industries:
- Electronics: Detect solder joint defects early and reduce rework by 20%.
- Automotive: Correlate torque and vibration data for predictive quality insights.
- Medical devices: Monitor process stability to ensure full traceability and compliance.
- Industrial equipment: Track multi-line performance to improve OEE by 10–15%.
Implementation Best Practices
Begin with one high-impact line or process to prove ROI quickly.
Leverage machine, MES, and test data before adding new sensors.
Train engineers and operators to interpret insights and act in real time.
Replicate successful configurations across sites using the same data model.
FAQ
What makes a factory “smart”?
A smart factory connects machines, data, and analytics tools to make autonomous decisions and predict outcomes before issues occur.
Can I integrate existing test systems and sensors?
Yes, platforms like QualityLine integrate with legacy test equipment, AOI/SPI, and MES data without requiring hardware replacement.
What ROI can manufacturers expect?
Typical results include 10–30% scrap reduction, 15–25% faster troubleshooting, and 10–20% improved FPY within the first 6 months.
Turn Data into Action
Discover how a unified Smart Factory Analytics Platform transforms your plant’s performance, from predictive insights to profit-driven decision-making.
